
Generation Z is pacing ahead for homeownership relative to other generations. This is despite the many hurdles they’ve faced, including:
The COVID-19 pandemic
Rising inflation
A turbulent economy
A recent Redfin study found that 30% of 25-year-olds owned their home in 2022 — more than Generation X (27%) and millennials (28%) when they were that age.
In my own family, my older daughter is a millennial. My younger daughter is Gen Z. And both of my children were able to own a home (with the help of mom and dad) in their mid 20s. So, they’re right smack dab in this trend.
Gen Z property hotspots: Where America’s youngest are buying homes
There’s a growing trend of Gen Zers moving to large cities. Again, using my own children as examples — even though one of them is a millennial. However, both live in cities — the eldest in the Washington, DC metro area. And the youngest is in Pittsburgh but will soon be relocating to the Bay Area of California.
Anyway, the research team at Today’s Homeowner took a closer look at where homeownership is most attainable for this generation. Using localized statistics from the Census Bureau, we created a proprietary score on Gen Z homeownership achievability for 70 of the largest U.S. cities.
Check out our findings below and review our Methodology section for more information on the data.
This higher homeownership rate among Gen Zers is location dependent, however. U.S. Census Bureau data shows that roughly one in eight (16.7%) Gen Z householders (all adults under 25) own their homes. But across 70 of the largest U.S. cities, only nine cities surpass that rate.
Main Findings of Gen Z homeownership
- More than one in five Gen Zers own their homes in three large U.S. cities. They include Stockton, California (22.7%), Albuquerque, New Mexico (21.7%, and Phoenix, Arizona (21.0%).
- Two cities in both Texas and Oklahoma rank in our top 10 cities for Gen Z homeownership.
- No cities in the Northeast nor the West made the top 10. The highest-ranking Northeastern city is Pittsburgh, Pennsylvania (No. 23), and the highest-ranking Western city is Mesa, Arizona (No.11).
- The Pacific Northwest falls behind. Seattle, Washington; Portland, Oregon; and Oakland, California, all rank in the bottom five worst cities for Gen Z homeownership.
So, what are the most and least attainable cities for Gen Z homeowners? We compared cities across four factors spanning housing costs and income for Gen Z.
Also, we also ranked the best and worst cities for Gen Z homeownership using four factors:
- Gen Z homeownership rate
- Percentage of Gen Z renters who are cost-burdened
- Down payment-to-income ratio
- Price-to-rent ratio
Most attainable cities for Gen Z homeownership
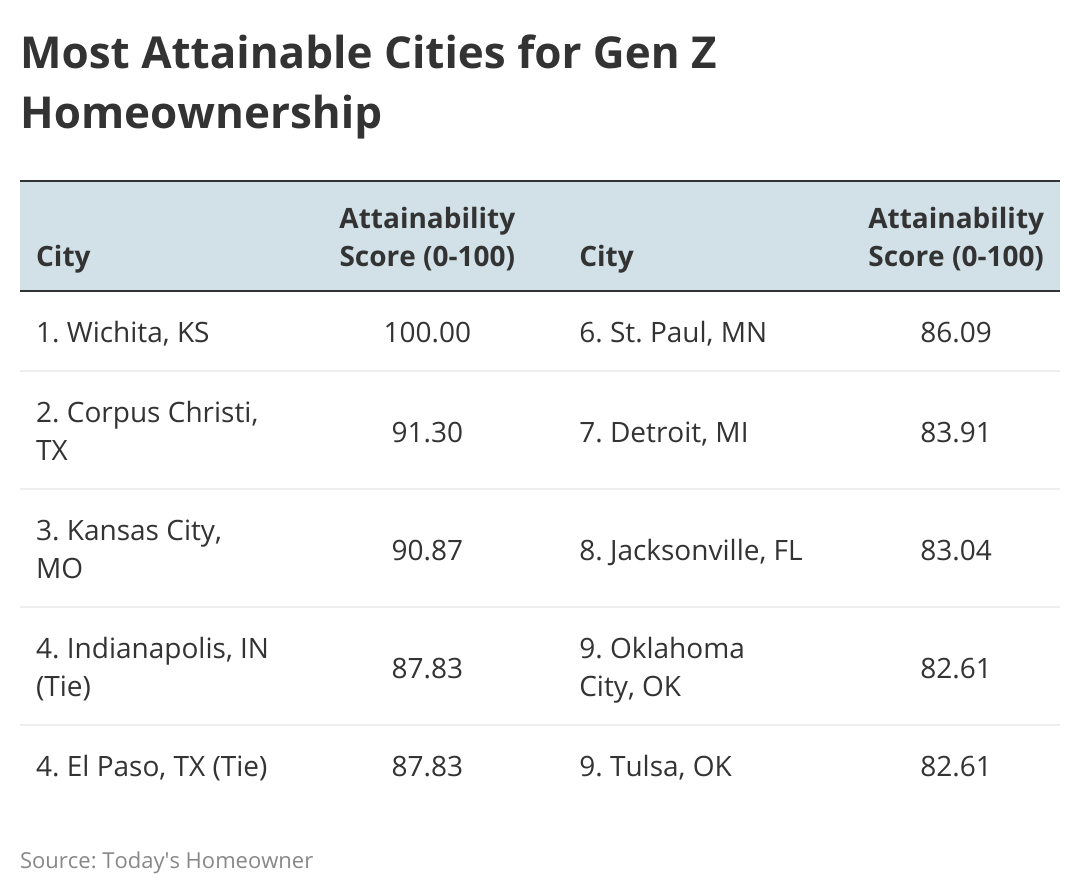
Many cities where homeownership is most achievable are in the Midwest and South. As previously mentioned, across the top 10 cities, two Texas and two Oklahoma cities are represented.
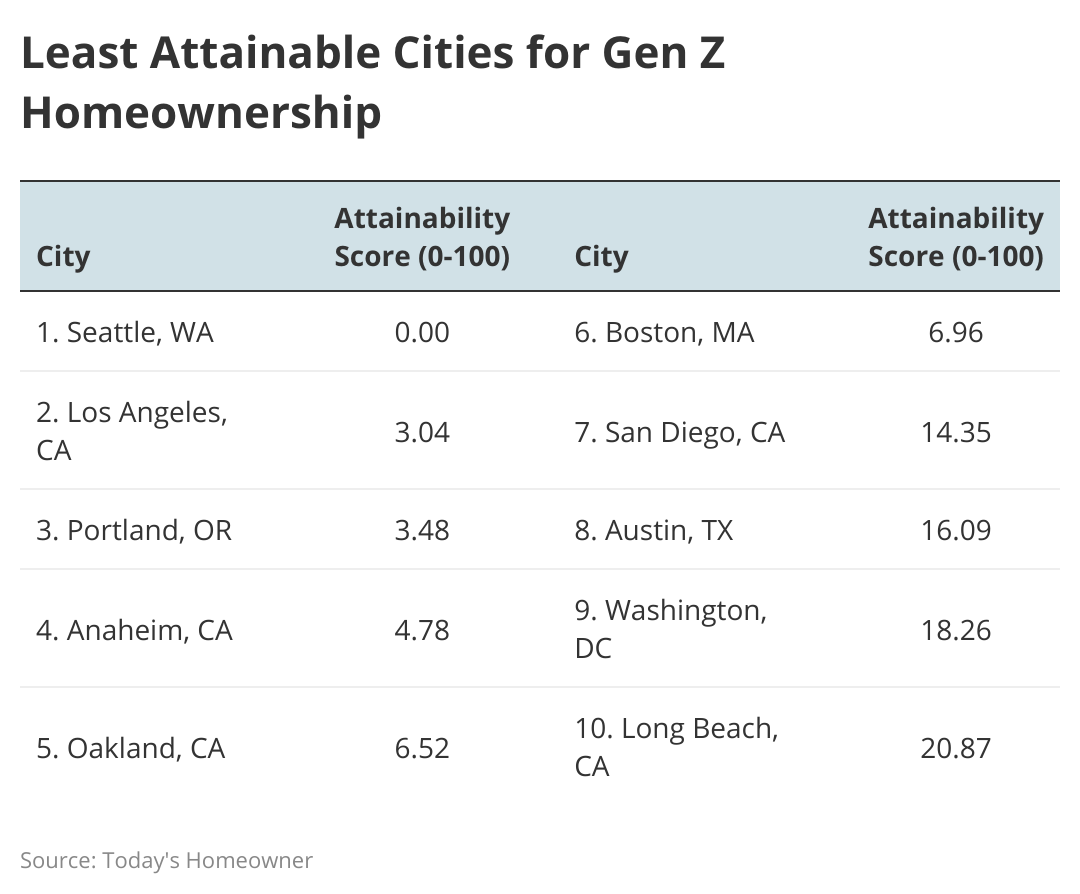
Least attainable cities for Gen Z homeownership
Gen Z homeownership is elusive in many Pacific Northwest cities, including Seattle, Washington, at No. 1 and Portland, Oregon, at No. 3. Additionally, five of the bottom 10 cities are in California.
Gen Z Homeownership Rates: High and Low
Now that we know where Gen Z homeownership is (and is not) the most attainable, let’s discuss each factor and the best- and worst-performing cities for each metric.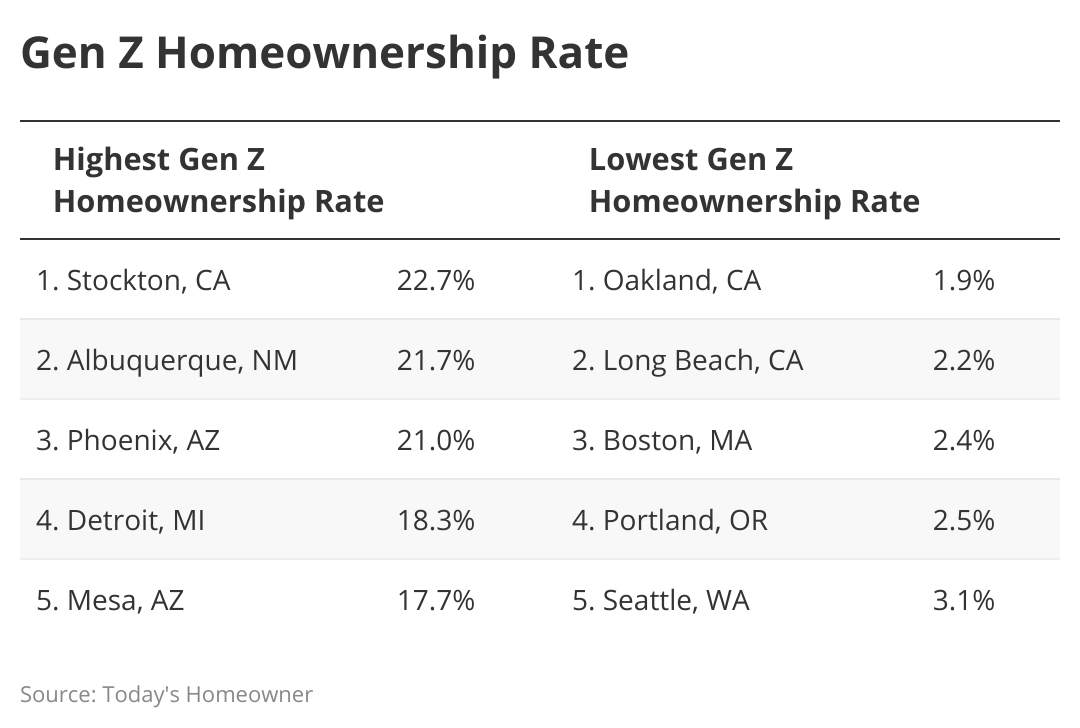
The Gen Z homeownership rate is the number of Gen Z homeowners relative to the number of Gen Z households.
Two cities in Northern California have the highest and lowest Gen Z homeownership rates. Stockton has the highest rate, while Oakland (nearby San Francisco) has the lowest, despite being less than 80 miles apart.
Housing cost-burdened Gen Z renters
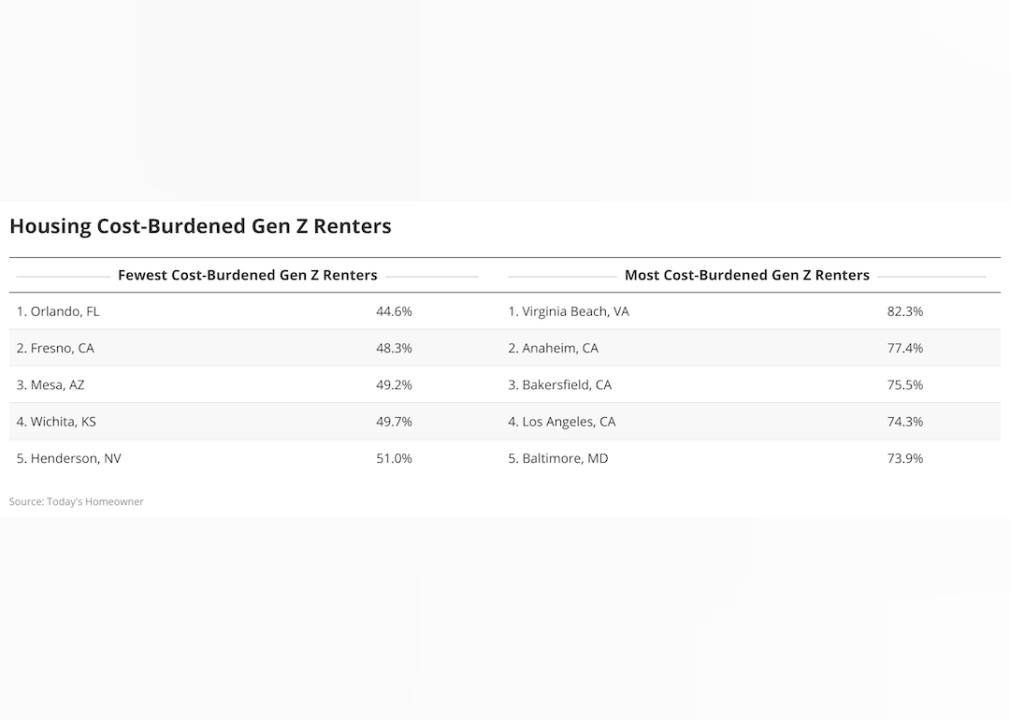
The Department of Housing and Urban Development (HUD) defines housing cost-burdened as paying more than 30% of pre-tax income on housing costs.
Most Gen Z renters are housing cost-burdened. Even in the best-performing city — Orlando, Florida — close to 45% of Gen Z renters are housing cost-burdened.
Down-payment-to-income ratio
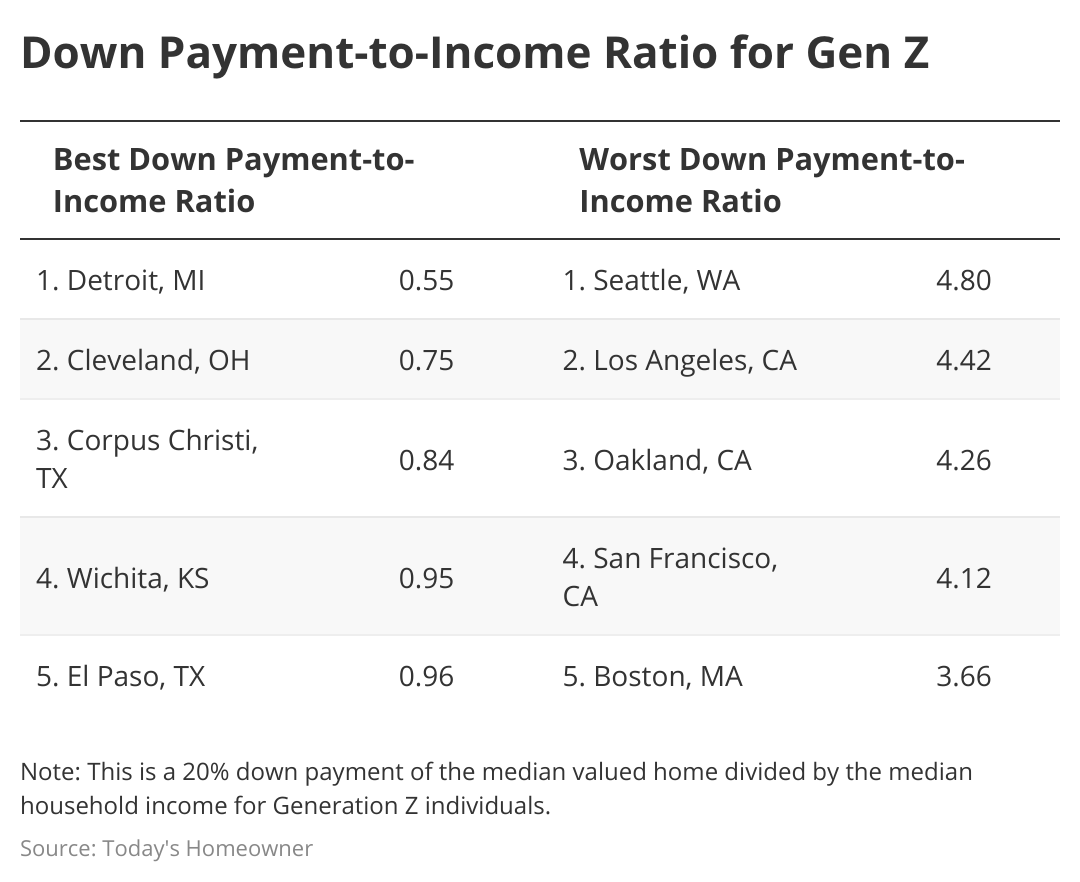
A higher down payment-to-income ratio indicates homeowners will need to spend more on their down payment relative to their income.
In four cities (Seattle, Washington, and three in California), individuals would need to pay more than four times their income to afford a 20% down payment on the median-valued home.
Price-to-rent ratio
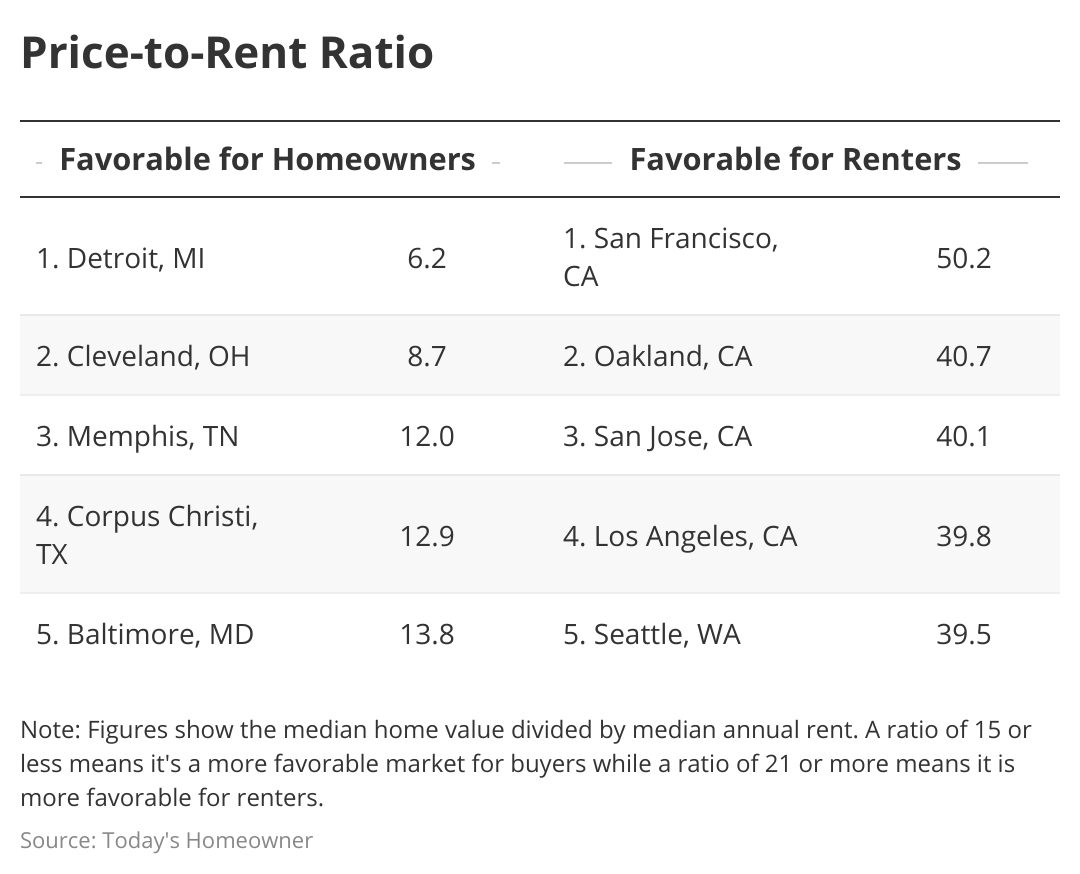
A price-to-rent ratio of 21 or more means a more favorable market for renters. In California’s San Francisco, the price-to-rent ratio exceeds 50.
In contrast, the Midwestern cities of Detroit, Michigan, and Cleveland, Ohio, show a more favorable environment for homeowners, with price-to-rent ratios of 6.2 and 8.7, respectively.
Buying tips for young prospective homeowners

Photo credit: Canva.
Young prospective homeowners may want to consider several criteria outside our analysis. These may include quality of life factors, the job market, and home value appreciation.
Quality of life factors
Wichita, Kansas is the most attainable place for Gen Z homeownership. But if your favorite activity is surfing, you probably won’t want to purchase a home there.
“When choosing a property, you need to identify the amenities and lifestyle that matter the most to you,” said Mitchell David, a longtime real estate agent and founder of Beach Life Premier Team. “Consider the availability of shopping centers, recreational activities, restaurants, and community services in the area.”
Job market
You’ll likely want to pick a home in a city where you can grow your career. According to a recent study from MoneyGeek, these are the best cities for Gen Z job seekers:
- Provo, Utah
- Austin, Texas
- Ogden, Utah
The type of career you want to pursue may also sway your home-buying decision. For example, Kansas City, Missouri, and Indianapolis, Indiana — ranked third and fourth most attainable cities for Gen Z homeownership — are hot-spot cities for eCommerce jobs.
A hot job market will also attract more people to your city. This, in turn, can help increase your home value.
Home value appreciation
You’ll be able to buy a much bigger home if you choose to buy in a less desirable area. However, your home value is less likely to increase in this case.
Purchasing a small- or medium-sized home in an “up and coming” neighborhood is a much more sound financial investment. Especially if you’re planning for this to be a starter home that you plan on selling. By keeping up with home repairs through a home warranty plan, your investment may pay off.
Methodology
Today’s Homeowner compared 70 of the largest U.S. cities across four metrics to rank the most and least attainable cities for Generation Z homeownership. We explain these four metrics below and their sources:
- Gen Z homeownership rate. This is the number of Generation Z homeowners divided by the total number of Gen Z households.
- Percentage of Gen Z renters who are housing cost-burdened. This is the percentage of Gen Z renters spending 30% or more of their pre-tax income on rent.
- Down payment-to-income ratio. This is a 20% down payment of the median-valued home divided by the median household income for Gen Z individuals.
- Price-to-rent ratio. This is the median home value divided by the median annual rent. A ratio of 15 or less means a more favorable market for buyers, while a ratio of 21 or more is more favorable for renters.
Data for all metrics comes from the Census Bureau’s 2021 1-year American Community Survey.
Finally, we calculated an average ranking using the four metrics above and weighting them all equally. The most attainable city scored 100, while the least received a 0.
This story was produced by Today’s Homeowner and reviewed and distributed by Stacker Media Stephanie Horan and Kristina Zagame contributed.